
Cross-border metrics help teams act on the same number, not fill another dashboard. Before a metric enters a meeting, document its decision, formula, source, refresh cadence, and exception rules. Otherwise, one label may hide different calculations. This guide uses an illustrative on-time handoff rate; adapt the rules and figures to your workflow.
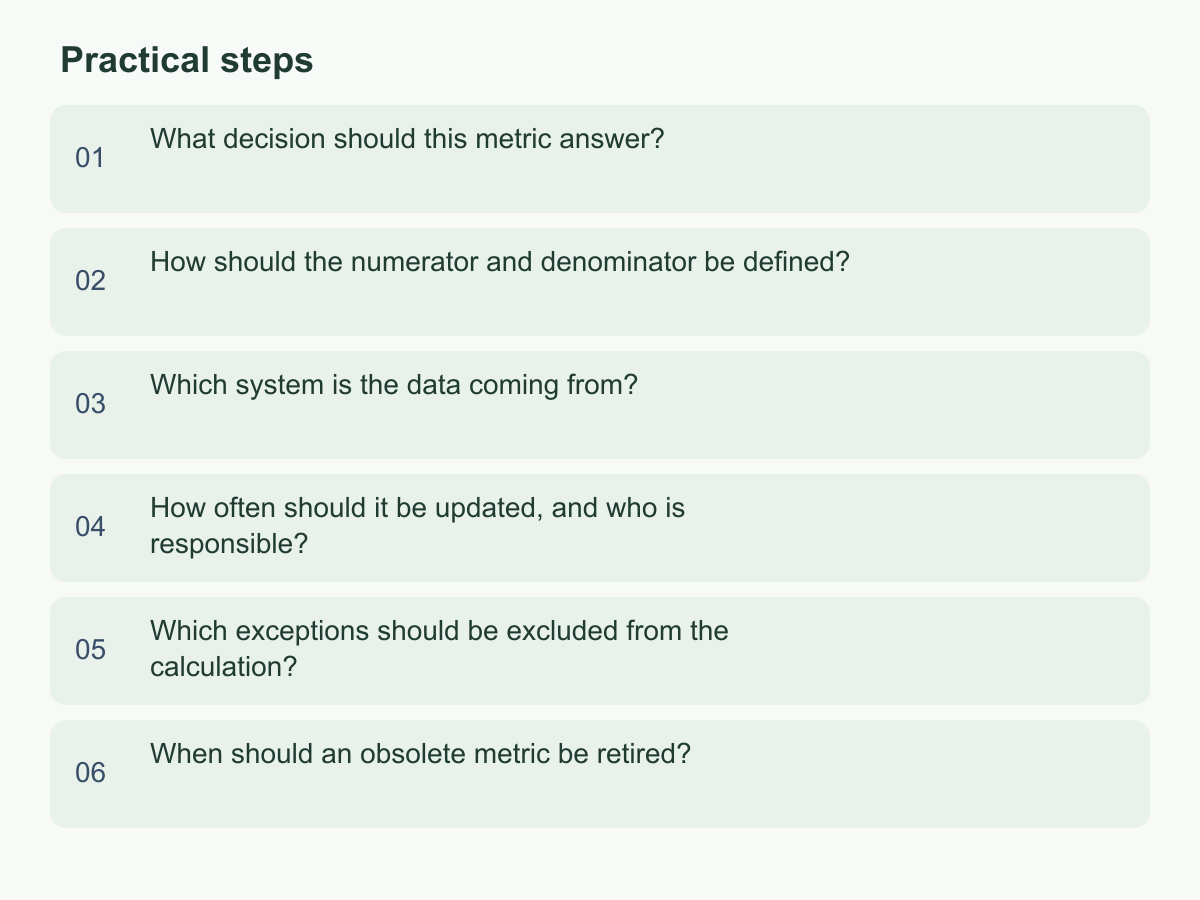
What decision should this metric answer?
Connect each metric to one choice: add shift staff, adjust inventory, investigate a handoff step, or pause a promotion. “Monitor operations” is too broad. On the metric card, state the decision, trigger, action owner, deadline, and result to check.
For example, when deciding whether to change this week’s support hours, ask whether pending orders due this week warrant a shift change. Pending orders can guide advance staffing; an overdue handoff rate shows missed commitments. These signals answer different questions.
Give each metric one primary decision. If one number serves staffing, performance assessment, and demand forecasting, define separate measures. Share definitions across markets; include market, channel, or product cuts only if they change an action. If data is still syncing, label the result provisional and defer the decision; missing data is not zero.
Ask the decision owner whether the number could change next week’s plan. If no practical next step exists, narrow its purpose or remove it from the recurring report. Compare markets only when their decisions and control of the process are comparable; scale differences alone do not show execution quality.
How should the numerator and denominator be defined?
Write the formula so another person can recalculate it. Specify the numerator, denominator, unit, period, and time boundary. For example: on-time handoff rate = valid orders due in the period and handed off before each promised time ÷ valid orders due in the period × 100%. Name the observable event that counts as a handoff. Dispatch in one market and transfer to a carrier in another are not interchangeable for comparison.
Keep orders that came due but remain incomplete in the denominator; otherwise, unfinished work disappears. Use the same unit on both sides. Do not mix order counts with item counts; define a separate measure for item-level analysis.
Suppose 100 valid orders were due in a week and 88 were handed off before their promised times. The rate is 88 ÷ 100 = 88%. This is an illustrative calculation, not actual market performance.
Record the reporting time zone and how midnight events map to dates; if markets use local dates, define consolidation. For monetary metrics, specify original currency or approved conversion and retain both values. Record the agreed definition version and effective date. Keep unrounded counts: averaging market rates can differ from calculating the combined rate.
Which system is the data coming from?
Name the source and fields required by the formula: order ID, due and completion times, status, and market code. Sources may include order-management platforms, logistics records, ERP or CRM systems, and spreadsheets; these are tool categories, not endorsements. Prefer records with stable IDs, status timestamps, consistent market codes, and a clear owner.
Map differing status values and preserve originals; similar labels may describe different events. Record the source, fields, extraction method, owner, and last refresh on the metric card so reports trace to underlying records.
Reconcile the same period and order set by ID. Check totals, missing records, and duplicates; document differences and their treatment instead of changing results to force a match. For a maintained spreadsheet, retain the entry owner, update dates, change history, and field definitions, and manage formulas in one place.
For personal-data metrics, collect only calculation fields, limit access, and follow applicable handling requirements. If a source lacks a needed field, state the limitation or choose another source; do not guess. A field dictionary can track source and standard names, permitted values, blank handling, transformations, and owners. When a source or field changes, pause reporting, sample records, and update the mapping version.
How often should it be updated, and who is responsible?
Set refresh cadence by the decision deadline and source availability. Same-day work assignment may need pending items; process review may use a longer period of completed work. These are examples; choose a schedule that fits the data and action cycle.
Record the data cut-off, refresh deadline, review date, delay labels, and next definition check. Name a data owner for fields and extraction, a metric owner for formula and exceptions, and a decision owner for action. One person may fill several roles, but each duty needs an owner.
For cross-time-zone teams, document the standard time and each market’s cut-off. Compare only complete periods. If data is late, show coverage and gaps; do not label old data current. For manual updates, name a backup and keep an update log.
At review, check the value, timeliness, and relevance to the decision. The data owner marks completeness, the metric owner samples counts, and the decision owner reviews before the meeting. If incomplete, label the result pending, assign someone to finish, and set a review time. Do not report an estimate as complete.
Which exceptions should be excluded from the calculation?
Set rules before reviewing results. Define invalid cases, who decides, and how the decision is recorded. Consider test orders, duplicates, cancellations, partial completion, changed promised times, and source delays. Base exclusions on the metric’s purpose, not on whether a case worsens the result.
An on-time rate might exclude orders cancelled before their due time. For later cancellations, use a pre-agreed rule and record why. Match duplicates by stable ID. If partial orders cannot be treated fairly as whole orders, use item counts or a separate metric; apply the rule across markets.
Retain original and revised promised times and state which governs; a later deadline can conceal delay. Mark missing data pending or indeterminable, and exclude non-applicable cases only under the agreed rule. Neither equals zero. Show the denominator, excluded orders, and missing records for reconciliation.
If exceptions rise, check for source, workflow, or recording changes. Mark each case included, excluded, or awaiting confirmation with a reason; ask another market member to check boundary cases. If reviewers disagree, revise and date the definition, then recalculate affected periods to separate corrections from operational changes.
When should an obsolete metric be retired?
Review metrics regularly. Pause or replace one when its decision has ended, no one can name an action it prompts, or the source lacks required fields. Long tenure alone is not a reason to keep it.
A stable number may show a healthy process or fail to reveal new problems. Compare it with actual cases and team observations. If teams pursue it at the expense of service quality or move work outside its scope, revisit the formula and exceptions; a companion quality measure may expose the trade-off.
Before replacement, define the new decision, formula, source, owners, and effective date. During transition, show both definitions and determine whether differences come from changed rules or operations. Retain the old definition, final reporting period, and retirement reason so readers can interpret historical breaks.
Ask whether the decision still has an owner, the source can recalculate reliably, and markets get comparable results under shared rules. Record missing data or process changes. If a pause is temporary, preserve history. Date new definitions rather than joining unlike calculations into one trend.
As a next step, ask two markets to recalculate a current staffing or handoff metric from the same metric card. Reconcile differences and take the confirmed definition to the next meeting. For more Chan & Chung content, visit the English homepage.